
GUIDES


When a webmaster opens the offers catalog, the first thing they usually look at is the rate.
And that makes sense. The rate is what drives the economics of a launch and the potential profit. For a long time the problem was that base rates gave almost no sense of the terms on which work with an offer is actually done (i.e. where the “market” really sits).
At Shakes Pro we solved this and made the terms more transparent by adding a new metric — “Average Effective Rate.”
Now, when picking nutra offers and media-buying offers, you can see the indicated potential for rate growth under certain conditions before you even start.
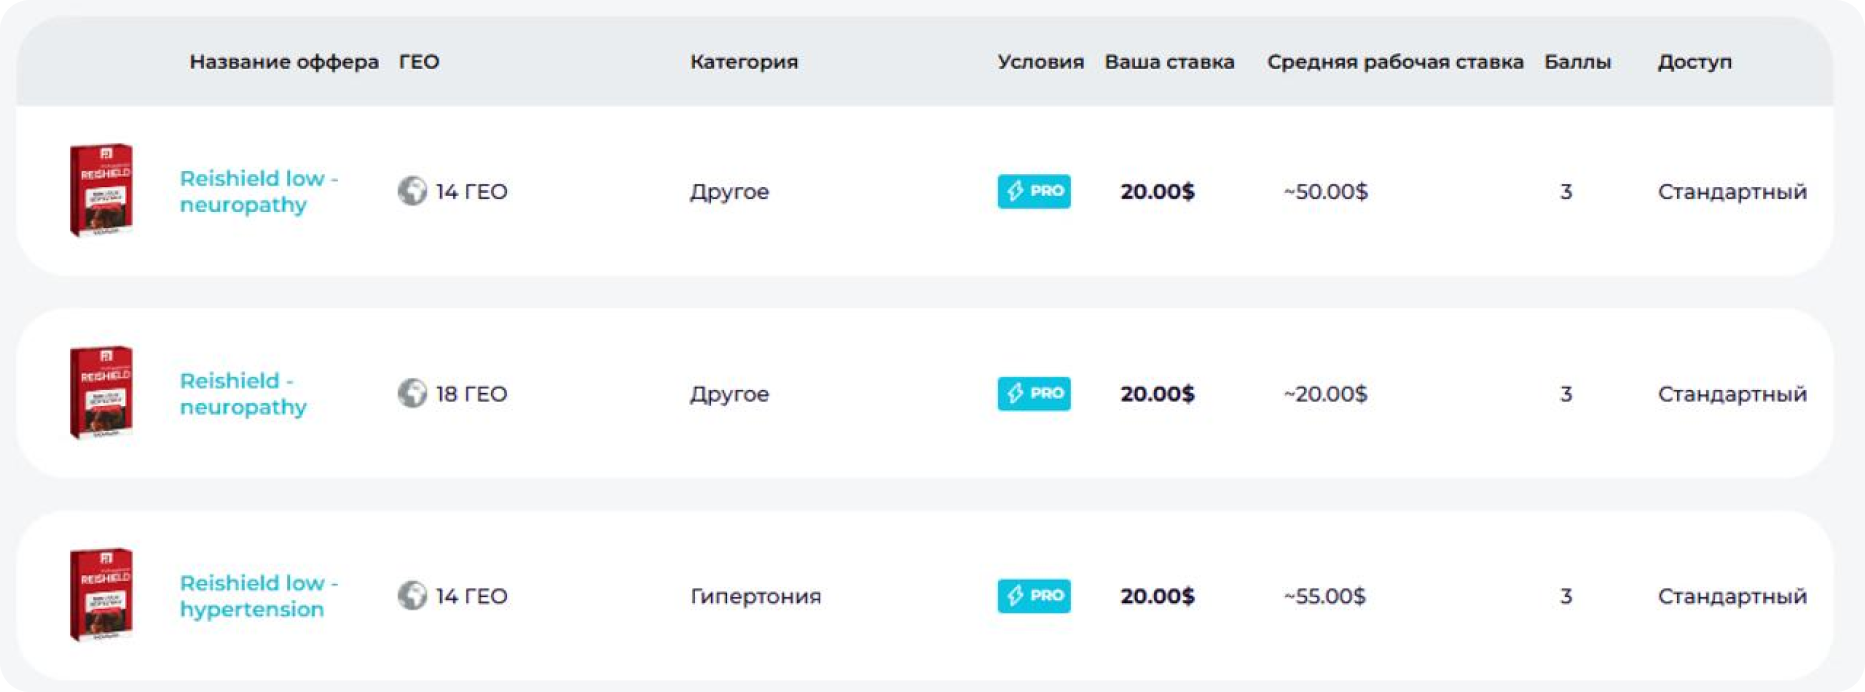
What the average effective rate shows
The average effective rate is the average of the personal rates that partners already work on for a specific offer. If there are no individual terms yet, the average effective rate matches the base rate. So now two figures are shown side by side:
- Your rate — the terms in effect right now.
- Average effective rate — a benchmark based on the terms other partners already work on.
At first glance the change is small, but in practice it lets you assess an offer’s potential much faster.
In other words, we’ve started showing which of our offers there is open interest in — and how strong it is.
Of course, the effective rate is a benchmark, not a promise
There’s one important thing to keep in mind.
The average effective rate doesn’t mean every partner will instantly get exactly that payout.
It shows the real picture for an offer and helps you understand which terms have already been agreed within the partner network.
An individual rate always depends on several factors:
- traffic volume;
- lead quality;
- the traffic source used;
- experience working with the offer;
- scaling potential.
So the final terms are always discussed individually — though either way, an offer’s potential is now far more visible.
How to use the new column when choosing an offer
Imagine you’re choosing between several offers.
At first glance the rates look identical — $20 each.
But once the new column appears, it becomes clear that the average effective rate differs by a factor of two, and sometimes several times over.
That makes it easier to see which nutra offers more often get individual terms, and where rate-growth potential is visible.
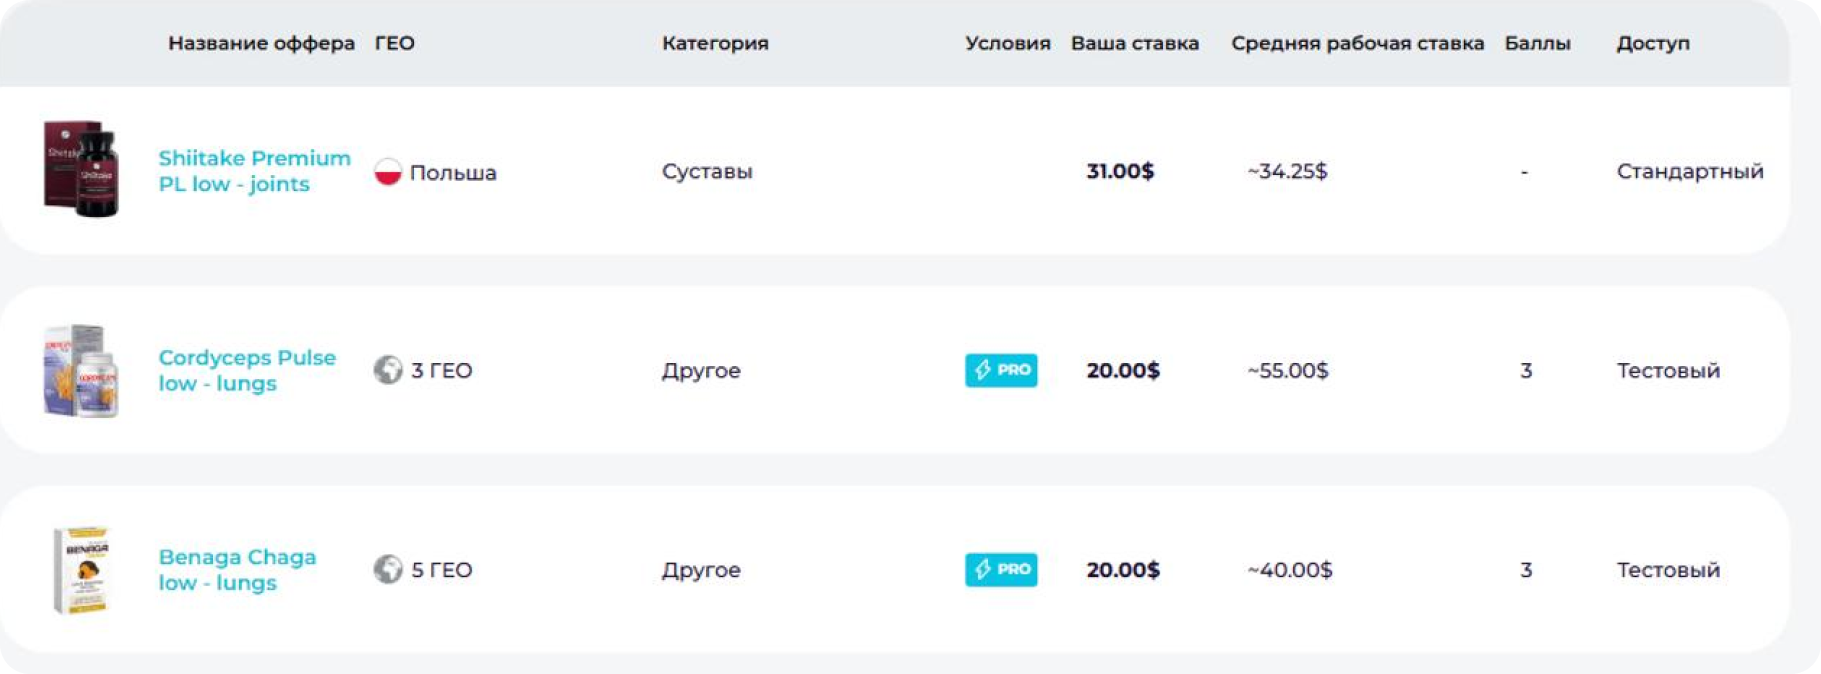
Comparing offers is now much easier
The average effective rate is one more tool that makes working with the catalog more transparent. It helps you assess an offer’s potential faster, spot where there’s room to grow, and make decisions based on real figures rather than guesswork.

If you haven’t checked the Shakes Pro catalog in a while, now’s a good time to see how the offer information has changed. Your next launch might turn out more profitable than it looks at first glance.

You may also like
 GUIDES
 Logistics in the COD Model: How Delivery Times Affect Redemption
We break down what happens to an order after approval, why delivery speed determines half the result in COD nutra, and where the differences in redemption rates across GEOs come from.
 GUIDES
 The COD Nutra Buyer Profile: Who They Are and How to Build a Funnel for This Audience
Who actually orders nutra products with cash on delivery, how this person makes decisions — and what the funnel must do at every step to carry the order through to purchase.
 GUIDES
 Where Your ROI Leaks: Blacklists and Traffic Noise That Eat Into Profit
An analysis of 33,181 blacklisted leads: why the problem comes from a small pool of repeat numbers and what it changes in how you evaluate a GEO.